How would have the best set and forget XI done by this point (at the end of Game week 29) ? Or how much points difference there could have been between dream XIs (where only max 3 players from a team is allowed) of every formation ?
I wrote an algorithm to find that out and the results were interesting, specially when I looked upon to find out the current #1 has total 1878 points.
Please note, the algorithm:


till next post :)
I wrote an algorithm to find that out and the results were interesting, specially when I looked upon to find out the current #1 has total 1878 points.
Please note, the algorithm:
- Does not consider the total budget, meaning it might not have been possible to put 4 other bench players within the initial FPL budget of 100 in some cases. Eg. Best 343 would have cost 87 & Best 352 would have costs 89 for 11 players alone.
- Does not consider players who joined the league late (eg. Alonso) - hence it would have been impossible to have this team starting from game week 1. However, it also means that someone else in that position could have played in those missing game weeks and the total would have been even more.
- Does not consider the games missed though injury, suspensions or any other reasons - again someone from bench would have replaced such players and the total would have been even more.
- Allows max 3 players from any team - FPL rule.
Now here are the teams:

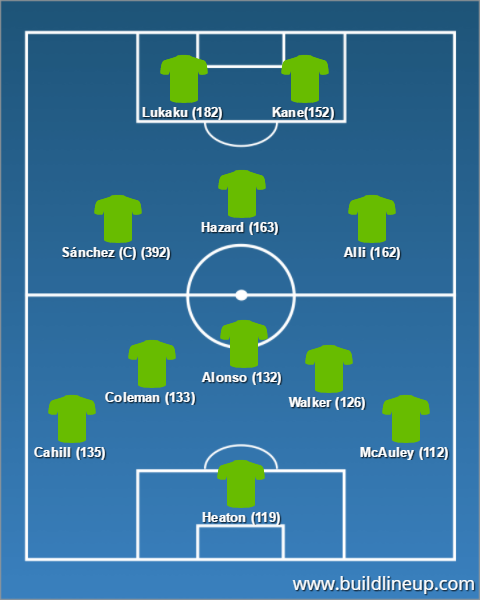
Best 541
Total pts = 1809
Initial cost = 79
Current cost = 86

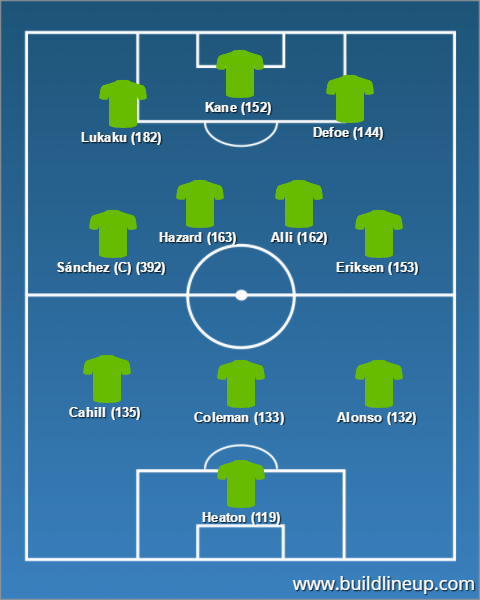
Best 343
Total pts = 1867
Initial cost = 87
Current cost = 93.5

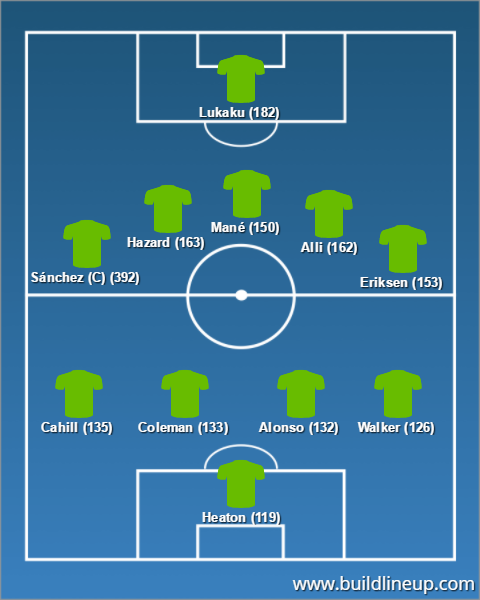
Best 352
Total pts = 1873
Initial cost = 89
Current cost = 95.3

Best 433
Total pts = 1840
Initial cost = 84
Current cost = 91.1

Best 442
Total pts = 1841
Initial cost = 81.5
Current cost = 88.6

Best 451
Total pts = 1847
Initial cost = 83.5
Current cost = 90.5
Best 532
Total pts = 1808
Initial cost = 81.5
Current cost = 88.5
till next post :)


